In my last post from September 2013, I noted that housing prices were once again increasing. At the time, I thought Vancouverites were rushing to get into the market before rates increased. But price increases have now continued for over a year and a half, so it seems clear that was not the reason. As I continued to watch the market, I tried to look for a better explanation. Other than the usual housing bubble rationalizations — everyone wants to live here, we’re running out of land, etc. — the conventional wisdom for recent gains seemed to be low interest rates. But even with historically low rates, housing affordability was already near record lows. It doesn’t seem plausible that already-strained households have been able to keep the party going for so long.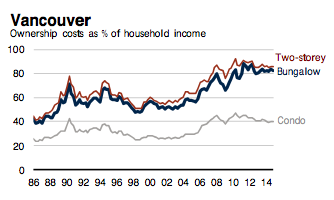 A market driven by low mortgage rates should look more like this:
  I also noticed a clear disconnect between the first phase of the bubble (2002-2008) and the second phase (2009-present). During the first phase, all of the Canadian bubble markets increased in a similar fashion. As an example, compare the price history of Victoria and Vancouver.
  The first peak occurred in mid-2008. Up until then, both markets moved together. But after the initial recovery in 2009, Vancouver began to behave differently than Victoria and other Canadian markets. Over the last 5-6 years, something very different has been going on here. In my opinion, the difference has been foreign buying — mostly from Mainland China. Unfortunately, there is no hard data on the amount of foreign ownership, so I’ve had to base my opinion on the excellent work of Ian Young, Andy Yan and others.
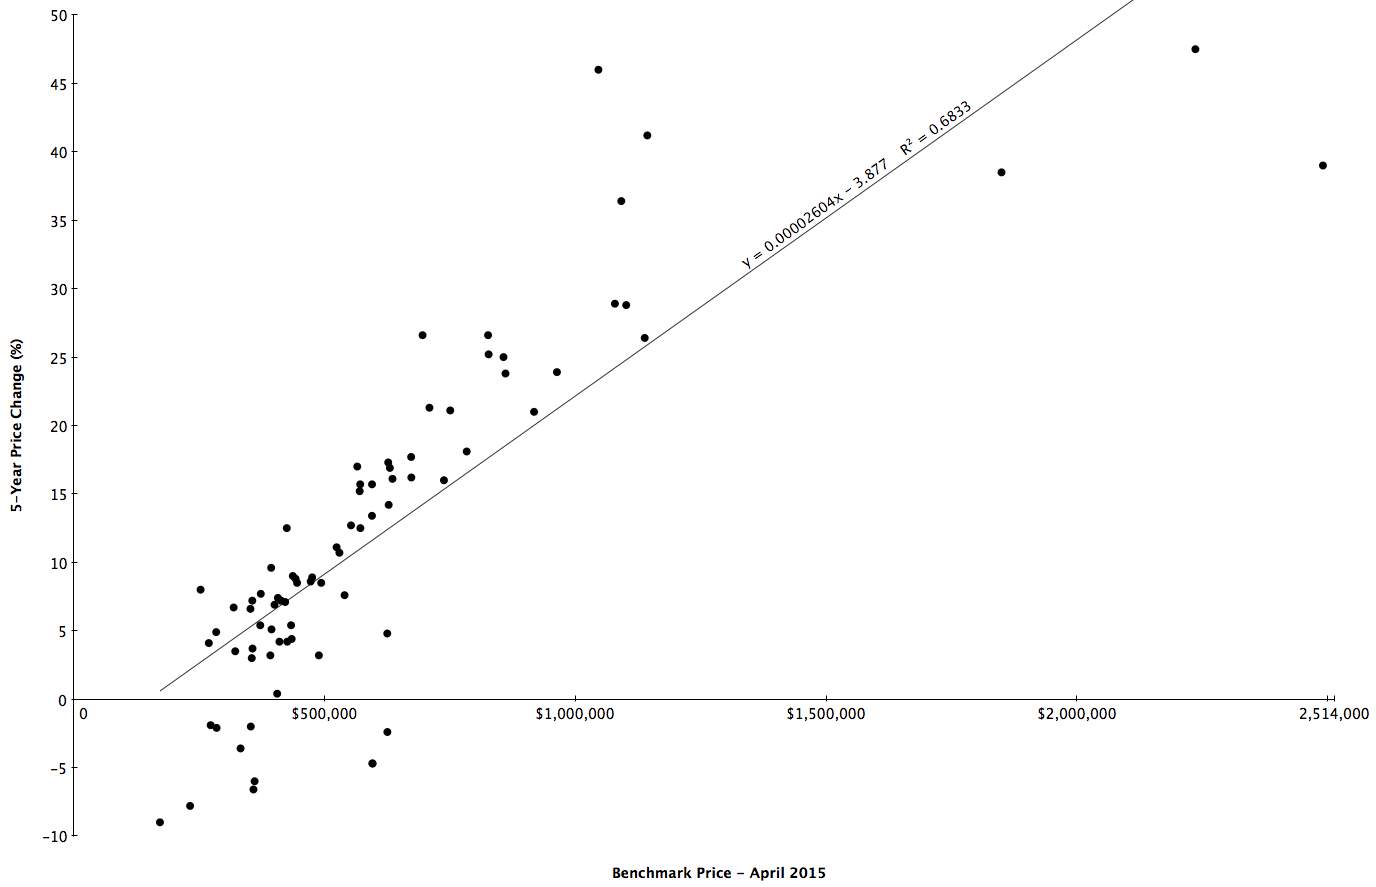
But after years of listening to claims that foreign buying is too insignificant to drive a market as big as Vancouver, I think I’ve found definitive proof. When housing markets are driven by easy financing and low mortgage rates, appreciation is higher for low-end, entry-level homes than it is for more expensive homes. Entry-level buyers are much more likely to max-out on debt than older, wealthier homeowners. This was the case in US bubble markets. For example, look at San Diego. Low-priced homes increased much more than high-priced properties. 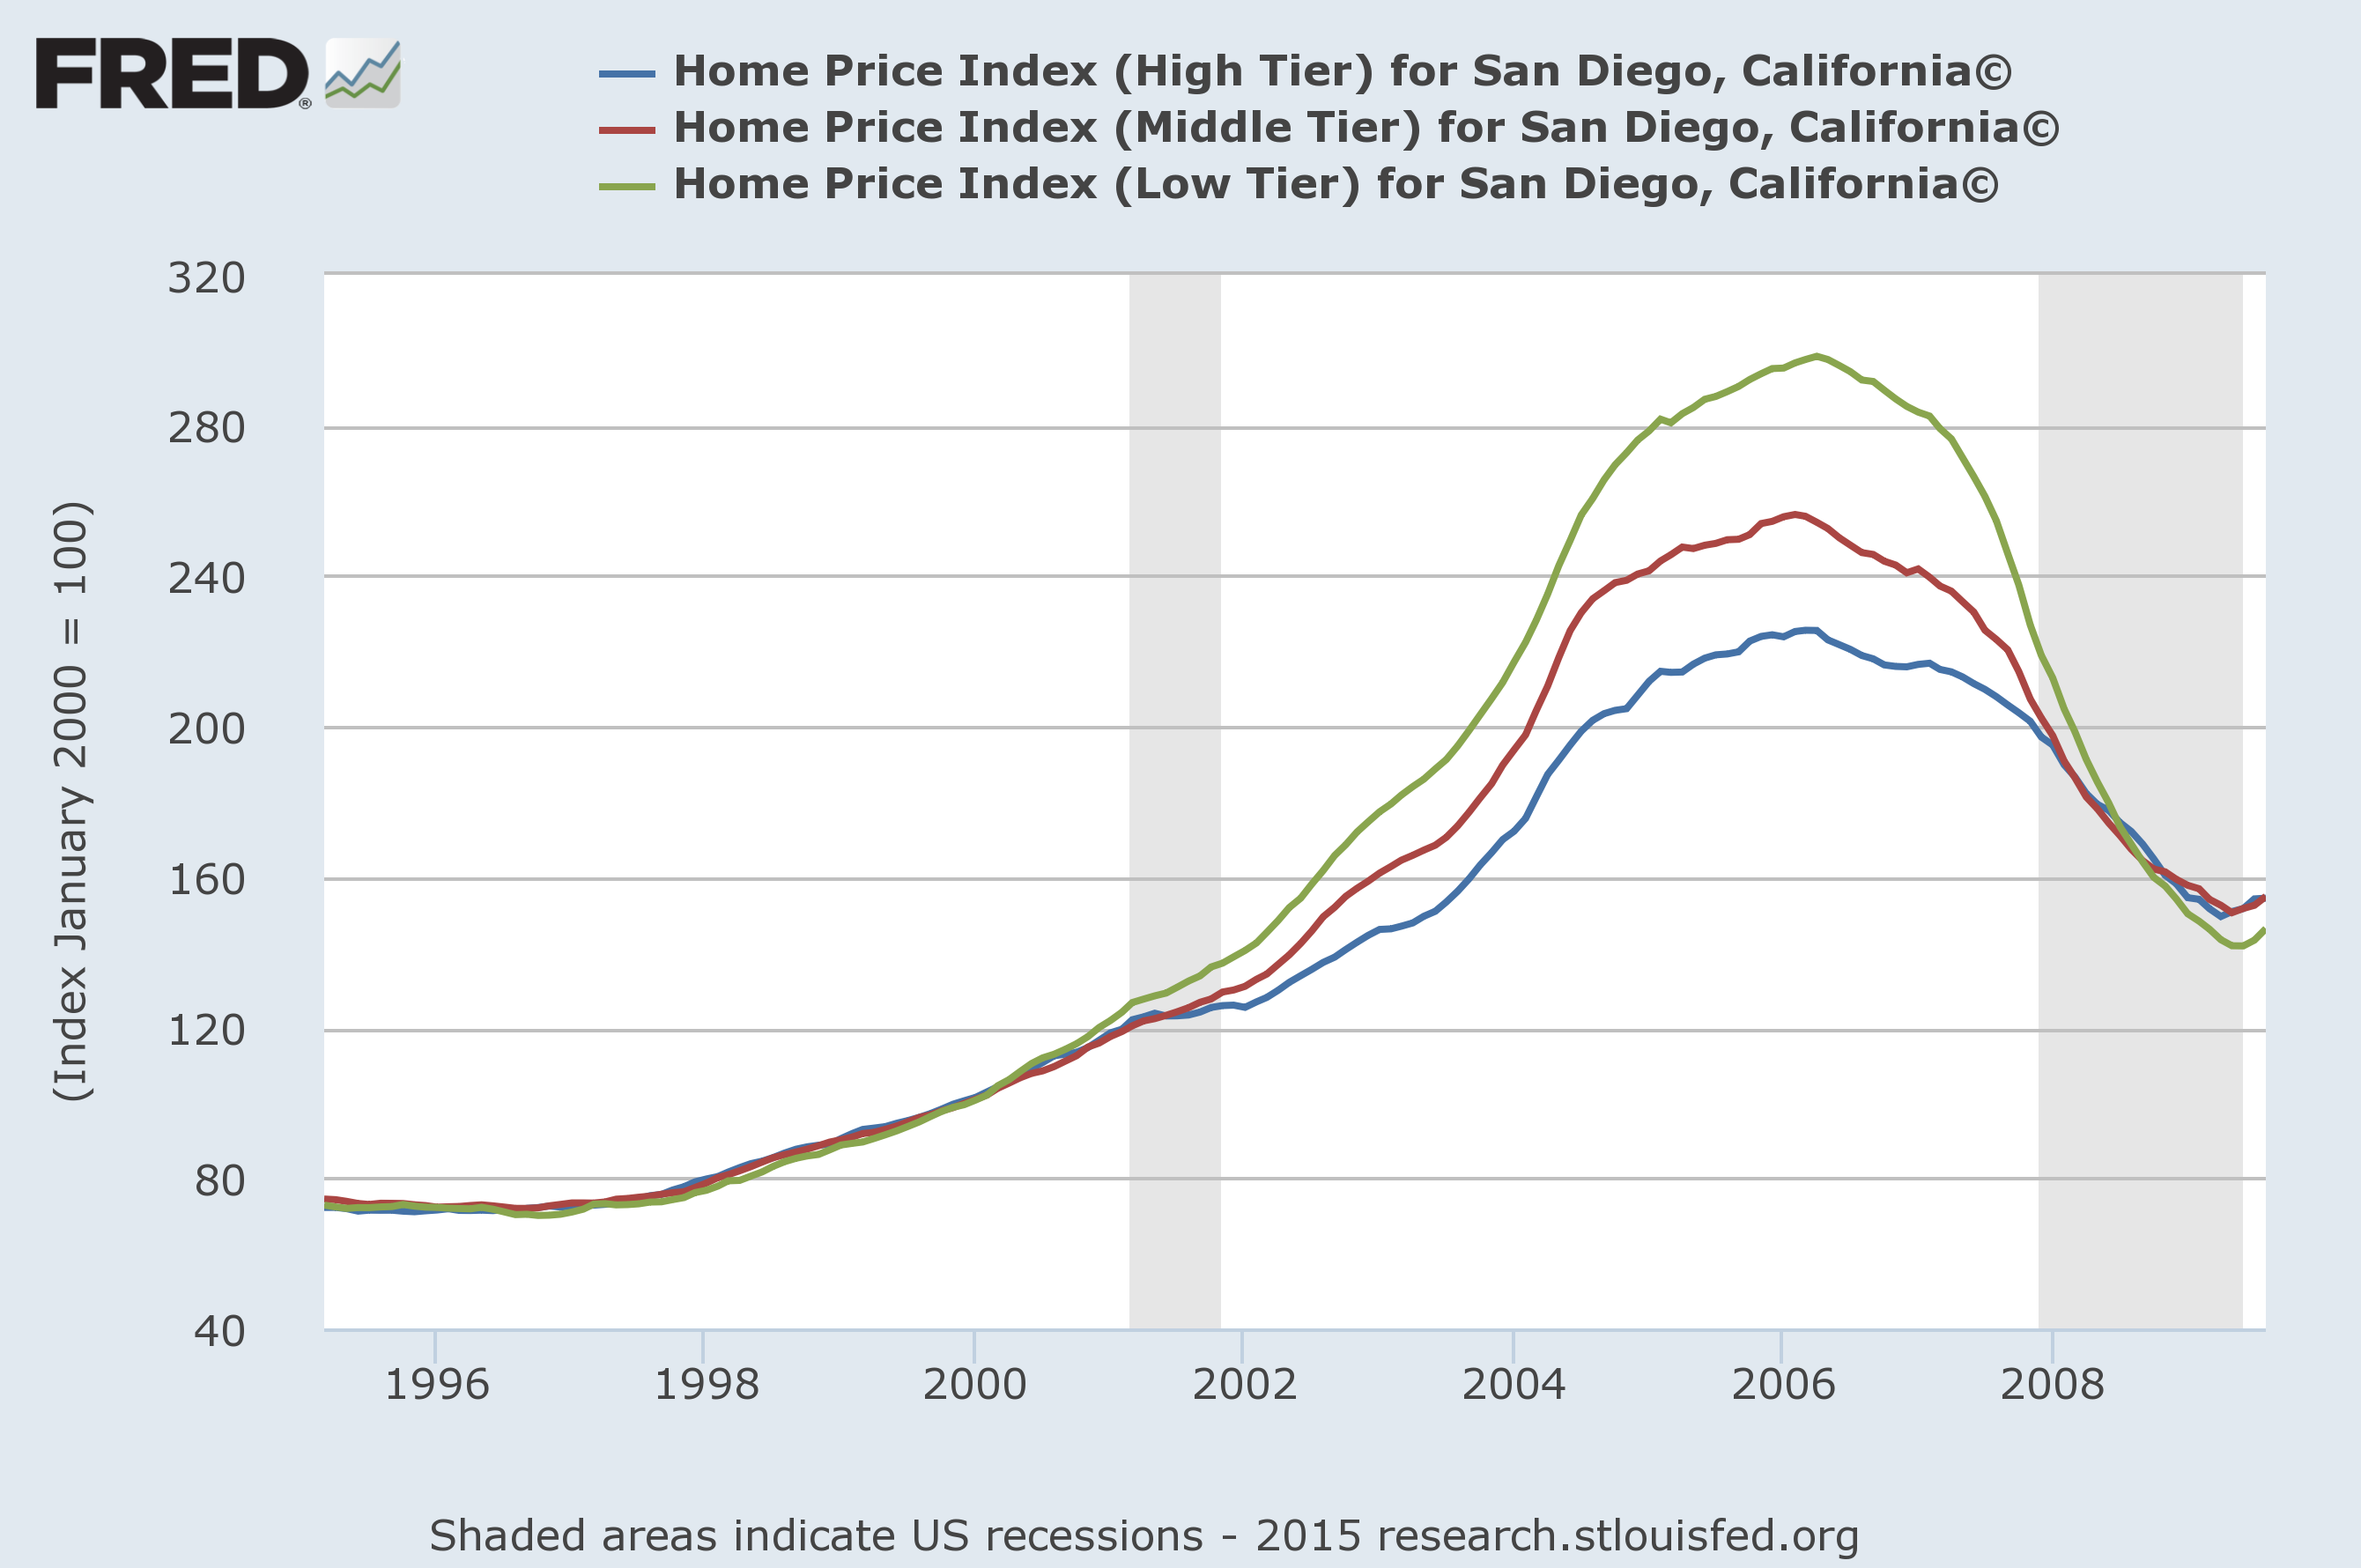 This was also true during the first phase of the Vancouver bubble. Here is a scatter plot generated from the April 2009 REBGV Stats Package, showing 5-year appreciation by price. It’s clear that lower priced properties appreciated more.

Click image for clearer view
I then created the same plot using data from the most recent Stats Package, and the results are pretty startling. High-priced homes have appreciated much more than less expensive properties over the last 5 years.
Click image for clearer view
I can’t think of any realistic scenario where local Vancouverites were able to send this bubble into overdrive with the help of lower mortgage rates — especially when you consider CMHC no longer insures mortgages on homes sold for more than $1 million. The only plausible reason I have been able to come up with is a massive influx of offshore wealth.
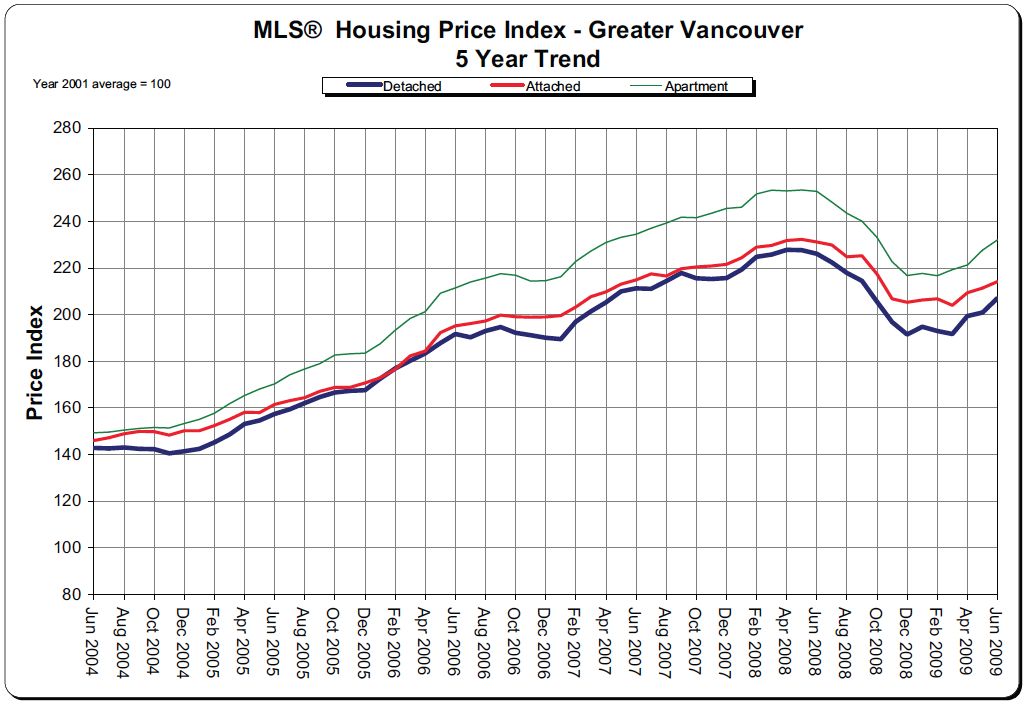
Update: Not everyone is familiar with scatter plots, so here are the MLS HPI graphs from the Real Estate Board. As in the scatter plots, these graphs confirm (lower priced) condos appreciated more before 2008, and (higher priced) single family homes have appreciated more in recent years.