Why The Liberals Like Unaffordable Housing

Yesterday, BC Finance Minister Mike de Jong added his voice to the chorus of BC Liberals who are afraid that stopping the influx of foreign capital or taxing speculators could have the undesirable effect of making homes more affordable.

“You have to be careful about having the state intervene to try to regulate pricing, or depress pricing. Those who are expressing a concern, if you really assess what they are seeking, it is a reduction in the value of homes in Vancouver and that will have consequences for a lot of families”

It’s interesting that the Liberals don’t seem too concerned about the “consequences for a lot of families” caused by the incredible decrease in affordability over the last 10-15 years.

Is he really worried about families? Or is there something else the Provincial Finance Minister — who’s had a hard time balancing the books lately — might be more concerned about?

BC Property Transfer Tax History

Property Transfer Tax revenue has tripled over the last decade. Affordable housing could create a big hole in the budget that Mr de Jong would have a hard time filling. But I’m sure he’s really concerned about families…

Is Speculation Really The Problem Now?

Yesterday, Gregor Robertson called for a speculation tax to help bring down housing prices.

We definitely need taxation tools that discourage speculation on real estate,” a statement from Robertson says. “It’s clear that rampant speculation on real estate is driving up prices in Vancouver. Vancouver needs the B.C. Government to take action on creating a speculation tax and recognize that we need a fair and level playing field to make housing more affordable for residents in Vancouver, and throughout the province.”

However, later in the day the BC Liberals repeated their apparent desire to keep housing prices from falling.

The ministry of finance responded with a statement late Friday, saying that “governments need to be careful that any tax would have the desired effect, without undermining the equity that people may have built up in their homes.”

As pointed out in Mystery Solved?, price increases over the last five or six years are being driven by the high-end. This is not indicative of a speculative market since very few people have the means to flip multimillion dollar homes. Tsur Somerville of UBC’s Centre for Urban Economics agrees.

“Think back to 2006 when people would line up overnight to buy a pre-sale condo then flip it within 30 days. That’s the sort of thing one would be looking for as proof of rampant speculation. There is very little evidence that is happening in the market right now.”

Instead, recent price gains are most likely coming from a massive inflow of offshore wealth into the region. And unlike the condo flipping of several years ago, these recent high-end buyers are looking for a safe place to park their wealth for the long term. They don’t appear to be speculating.

The effect this flood of offshore wealth is having on the Vancouver real estate market is undeniable. The frustration of Vancouverites seems to be reaching a tipping point, and they are finally starting to demand action by their elected officials.

But since speculation doesn’t appear to be the driving force in recent price gains, why is Robertson proposing this speculation tax now? Could it be just a diversion to take the heat off foreign capital inflows? A way to appear proactive, without actually solving the affordability problem?

Affordable Lifestyle Restriction

The Agricultural Land Reserve (ALR) was a good idea when it was introduced in the 1970s. Having lived in Los Angeles, I would never want to see that kind of urban sprawl here.

But if too much land is off-limits to development, the ALR can needlessly increase the cost of housing to the point where it does more harm than good. After all, what’s more important, locally grown potatoes or an affordable home? And with all due respect to the Condo King, not everyone is ready to “give up the dream” and embrace the micro-suite lifestyle. Especially when we don’t have to.

Have a look at this map created from the Agricultural Land Commission’s website. The ALR is in green.

ALR_Map

I don’t know what others think, but that looks pretty excessive to me. (The next time someone says we don’t have enough land because of the US border, show them this map).

It also doesn’t help that we’ve restricted development in the North Shore mountains. With a few public works projects, we could easily satisfy our water needs using other reasonably close sources. If there’s anything this Province has enough of, it’s water!

WatershedMapI’m not suggesting that we pave over paradise. But like with most things in life, there are trade-offs. Seems to me that if the cost of locally grown produce and locally sourced water is million dollar homes, it might be time to make some adjustments.

How “World Class” Is Vancouver?

One of the favourite justifications for high housing prices in Vancouver is, “we’re cheap compared to other world-class cities like Paris, Tokyo, London, New York, etc.”. In fact, Housing Minister Rich Coleman (following up on his comments from last week) gave this response a few days ago when asked about foreign ownership in Vancouver.

“I believe that the market place adjusts. If you notice over the years, it has fluctuations up and fluctuations down. If you look at the mean cost of housing across British Columbia and you compare it to other major cities worldwide, the reason it is attractive internationally is because it’s actually pretty reasonable compared to other cities like London, Singapore, Tokyo”

But is Vancouver really comparable to those cities?

Population

How does Vancouver compare to those other cities when it comes to metropolitan area population?

  • Tokyo: 34,607,069
  • New York: 20,092,883
  • London: 13,879,757
  • Paris: 11,978,363
  • Western Canada: 10,394,228 (west of Ontario)
  • Pittsburgh: 2,356,285
  • Vancouver: 2,313,328
  • Portland: 2,226,009

When it comes to population, Vancouver is not even close to the usual comparison cities. In fact, Tokyo, New York, London and Paris all have higher populations than Western Canada. On the list of North American Metropolitan Areas, Vancouver ranks 35th — right between Pittsburgh and Portland.

World City Rankings

The Globalization and World Cities Research Network has a methodology for ranking world cities. In their most recent analysis, the top four cities were: London, New York, Hong Kong and Paris. Vancouver ranks more than 60 places lower, most comparable to: Caracas, Riyadh, Chennai and Manchester.

A.T. Kearney compiles a Global Cities Index (GCI), which “examines a comprehensive list of 84 cities on every continent, measuring how globally engaged they are across 26 metrics in five dimensions: business activity, human capital, information exchange, cultural experience, and political engagement”. The usual comparison cities are all at the top. Vancouver ranked 48th.
Global Cites Top 20

The 3 most visited museums in the world are in Paris, New York and London. The Vancouver art gallery didn’t make the top 100.

Of the four major cross-border North American sports leagues (MLB, NBA, NHL, MLS), Vancouver has 2 teams and 0 championships. New York has 8 teams and 41 championships. Vancouver briefly had an NBA franchise, but lost it to fellow world-class city Memphis, Tennessee.

New York has Broadway, London has the West End, Vancouver has Granville Street?

Reasonable Comparisons

Vancouver is simply not in the same league as the truly world-class cities with which it is often compared. Two much more comparable cities are Portland and Seattle (similar populations, weather, natural beauty, etc.). So, how do these three cities compare when it comes to median house prices?

  • Vancouver: $704,800 CAD
  • Seattle: $359,100 USD
  • Portland: $291,300 USD

Sure, Vancouver is cheaper than truly world-class cities. But compared to similar cities, it is extremely overpriced.

The Modern Chinese Laundry

According to Global Financial Integrity, about US$1.252 trillion in illicit financial outflows left Mainland China between 2003 and 2012. In 2012, the amount of money leaving China had increased to an astonishing quarter of a trillion US dollars!!

Illicit Outflows 2003-2012

How much of that money is making its way to Vancouver? According to China’s list of the top 100 international fugitives, 26 of them were most likely in Canada. And according to Ian Young’s analysis of immigration data, 80% of Chinese millionaire immigrants to Canada are planning to locate in BC — the vast majority of whom likely settle in the Greater Vancouver area.

Using these figures, we can estimate the amount of hot money flows that could end up here. If we assume 26% of these financial outflows are destined for Canada, and 80% of those individuals locate in the Vancouver area, there was a potential flow of almost US$52 billion into the Vancouver area in 2012 alone!

According to the REBGV, total sales volume for the Greater Vancouver region was $18.6 billion in 2012 — only about 36% of the potential hot money flow from China that year.

Of course, not all laundered money ends up in real estate. But if only a small fraction of it does, that is more than enough to have a dramatic effect on local housing prices.


BC Liberals, “Let Them Rent”!

With all the recent attention this online petition to limit foreign buying in Vancouver has been getting, it’s elicited a few responses from the BC Liberals. Here is one from Rich Coleman.

Foreign buyers have flocked to one of Vancouver’s most hotly anticipated housing developments, raising new questions about whether it’s time government intervened in the city’s increasingly unaffordable real estate market.

B.C. Housing Minister Rich Coleman dismissed the idea of provincial intervention, however, arguing it would be unfair to people who have already invested in housing, including locals.

“The real estate economy has been a free market economy for decades and people have made significant investments based on that,” Coleman said.

“And to go out and decide that we’re going to put those investments at risk for British Columbians and folks that own property in B.C. doesn’t make a lot of sense to me.””

And here is another from Christy Clark.

Realtor Lorne Goldman estimates 25 per cent of his clients are foreign. While countries like Australia have put limits on what foreign investors can buy, Goldman wonders whether similar restrictions in B.C. “could backfire.”

Some fear such limits could stall the city’s real estate market, a sentiment shared by B.C. Premier Christy Clark.

“By trying to move foreign buyers out of the market, housing prices overall will drop,” said Clark. “That’s good for first-time home buyers but not for anybody who is depending on the equity in their home to maybe get a loan or use that to finance some other projects.”

So there you have it. The BC Liberals have spoken, and what they are saying is:

  • Foreign buying is driving up the price of housing.
  • They don’t want to stop it because it will decrease the windfall being enjoyed by long-time homeowners.

For all the lip service given to affordable housing, it’s clear from their actions that no level of government is interested in pursuing any policies which could actually make home ownership affordable to anyone who isn’t already on the gravy train. In other words, “Let them rent”.

Mystery Solved?

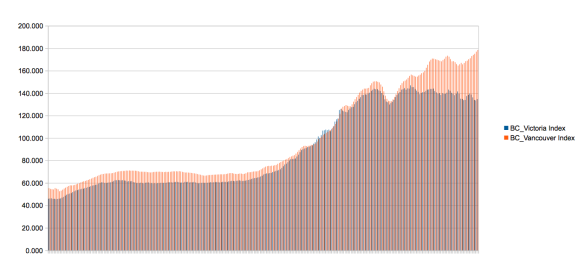
In my last post from September 2013, I noted that housing prices were once again increasing. At the time, I thought Vancouverites were rushing to get into the market before rates increased. But price increases have now continued for over a year and a half, so it seems clear that was not the reason. As I continued to watch the market, I tried to look for a better explanation. Other than the usual housing bubble rationalizations — everyone wants to live here, we’re running out of land, etc. — the conventional wisdom for recent gains seemed to be low interest rates. But even with historically low rates, housing affordability was already near record lows. It doesn’t seem plausible that already-strained households have been able to keep the party going for so long.RBC_Mar2015_Afford A market driven by low mortgage rates should look more like this: RBC_Calgary_Afford I also noticed a clear disconnect between the first phase of the bubble (2002-2008) and the second phase (2009-present). During the first phase, all of the Canadian bubble markets increased in a similar fashion. As an example, compare the price history of Victoria and Vancouver. Vancouver Vs Victoria The first peak occurred in mid-2008. Up until then, both markets moved together. But after the initial recovery in 2009, Vancouver began to behave differently than Victoria and other Canadian markets. Over the last 5-6 years, something very different has been going on here. In my opinion, the difference has been foreign buying — mostly from Mainland China. Unfortunately, there is no hard data on the amount of foreign ownership, so I’ve had to base my opinion on the excellent work of Ian Young, Andy Yan and others.

But after years of listening to claims that foreign buying is too insignificant to drive a market as big as Vancouver, I think I’ve found definitive proof. When housing markets are driven by easy financing and low mortgage rates, appreciation is higher for low-end, entry-level homes than it is for more expensive homes. Entry-level buyers are much more likely to max-out on debt than older, wealthier homeowners. This was the case in US bubble markets. For example, look at San Diego. Low-priced homes increased much more than high-priced properties. SanDiegoPriceTiers This was also true during the first phase of the Vancouver bubble. Here is a scatter plot generated from the April 2009 REBGV Stats Package, showing 5-year appreciation by price. It’s clear that lower priced properties appreciated more.

5 Year Change 2009

Click image for clearer view

I then created the same plot using data from the most recent Stats Package, and the results are pretty startling. High-priced homes have appreciated much more than less expensive properties over the last 5 years.

5 Year Change 2015

Click image for clearer view


I can’t think of any realistic scenario where local Vancouverites were able to send this bubble into overdrive with the help of lower mortgage rates — especially when you consider CMHC no longer insures mortgages on homes sold for more than $1 million. The only plausible reason I have been able to come up with is a massive influx of offshore wealth.

Update: Not everyone is familiar with scatter plots, so here are the MLS HPI graphs from the Real Estate Board. As in the scatter plots, these graphs confirm (lower priced) condos appreciated more before 2008, and (higher priced) single family homes have appreciated more in recent years.

HPI_2004_2009

HPI_2010_2015


Correctus Interruptus

A funny thing happened on the way to real estate sanity in Vancouver. Interest rates went up.

Canadian 10 Year Bond 1 Year Chart

Canadian 10 Year Bond 6 Month Chart

In the US, rising rates had the effect of cooling the market. Not so in real estate crazy Vancouver. It caused people to jump into the market before their rate-hold expired. After all, who cares if you overpay by hundreds of thousands? As long as you can save $150/month on your mortgage payment!

As a result of this latest round of buying activity, prices are once again increasing.

Vancouver House Price Index

Vancouver House Price Index

At some point in the future, housing prices in Vancouver will have to revert to fundamental value – that is a certainty. The current state of the market is simply unsustainable.

Vancouver Housing Affordability

Vancouver Housing Affordability

Canadian Price To Rent Ratios

Canadian Price To Rent Ratios

As is obvious from these charts, Vancouver housing prices have been ridiculously overvalued for at least six years. Over the past year, rising inventories, falling sales, tighter mortgage lending requirements and rising interest rates appeared to be the perfect conditions to finally cause the market to correct.

Unfortunately, the rise in rates seems to have put an end to the correction – at least for now. What happens in the short term is anyone’s guess. Is this the last gasp of air before the market goes under? Probably. Or is it the start of yet another few years of delaying the inevitable? Possibly. Either way, it doesn’t make sense to continue posting at this time.

When the market correction resumes, I might resume posting (if I’m still here). There’s a really nice city in the US that the wife and I are going to be visiting soon…

5 Year Benchmark

Up until now, we’ve only looked at individual examples of properties selling for a loss. I’m sure many people question if these examples are cherry-picked exceptions, or whether these losses are common.

Today I thought we’d do something different and look at a hypothetical five year situation. What would be expected if someone bought a Vancouver condo five years ago and sold today?

The Real Estate Board of Greater Vancouver (REBGV) tracks the price of a “benchmark” condo. The benchmark is intended to measure the price change for comparable properties over time. Similar to the Teranet HPI, or the Case-Shiller Index in the US, it should provide a better estimate for a given property than the average or median price.

According to the REBGV website:

The HPI benchmarks represent the price of a typical property within each market. The HPI takes into consideration what averages and medians do not – items such as lot size, age, number of rooms, etc. These features become the composite of the ‘typical house’ in a given area.

Each month’s sales determine the current prices paid for bedrooms, bathrooms, fireplaces, etc. and apply those new values to the ‘typical’ house model.

Five years ago (July 2008) the benchmark condo price was $381,687. The latest figure is $368,300.

  • July 2008 Benchmark: $381,687
  • July 2013 Benchmark: $368,300
  • Property Transfer Tax: $6,634
  • Real Estate Commission: $16,391
  • Loss: ($36,411)

The typical condo purchased five years ago and sold today would lose $36,411 – or 9.54%.